Increasing access to public spatial data is creating new opportunities for environmental and agricultural analyses. Among the recently released resources are datasets provided by the Agency for Restructuring and Modernisation of Agriculture (ARiMR), including LPIS and GSA layers containing information on reference parcel boundaries and crop types. These datasets can provide valuable support for analyses based on remote sensing methods and meteorological data.
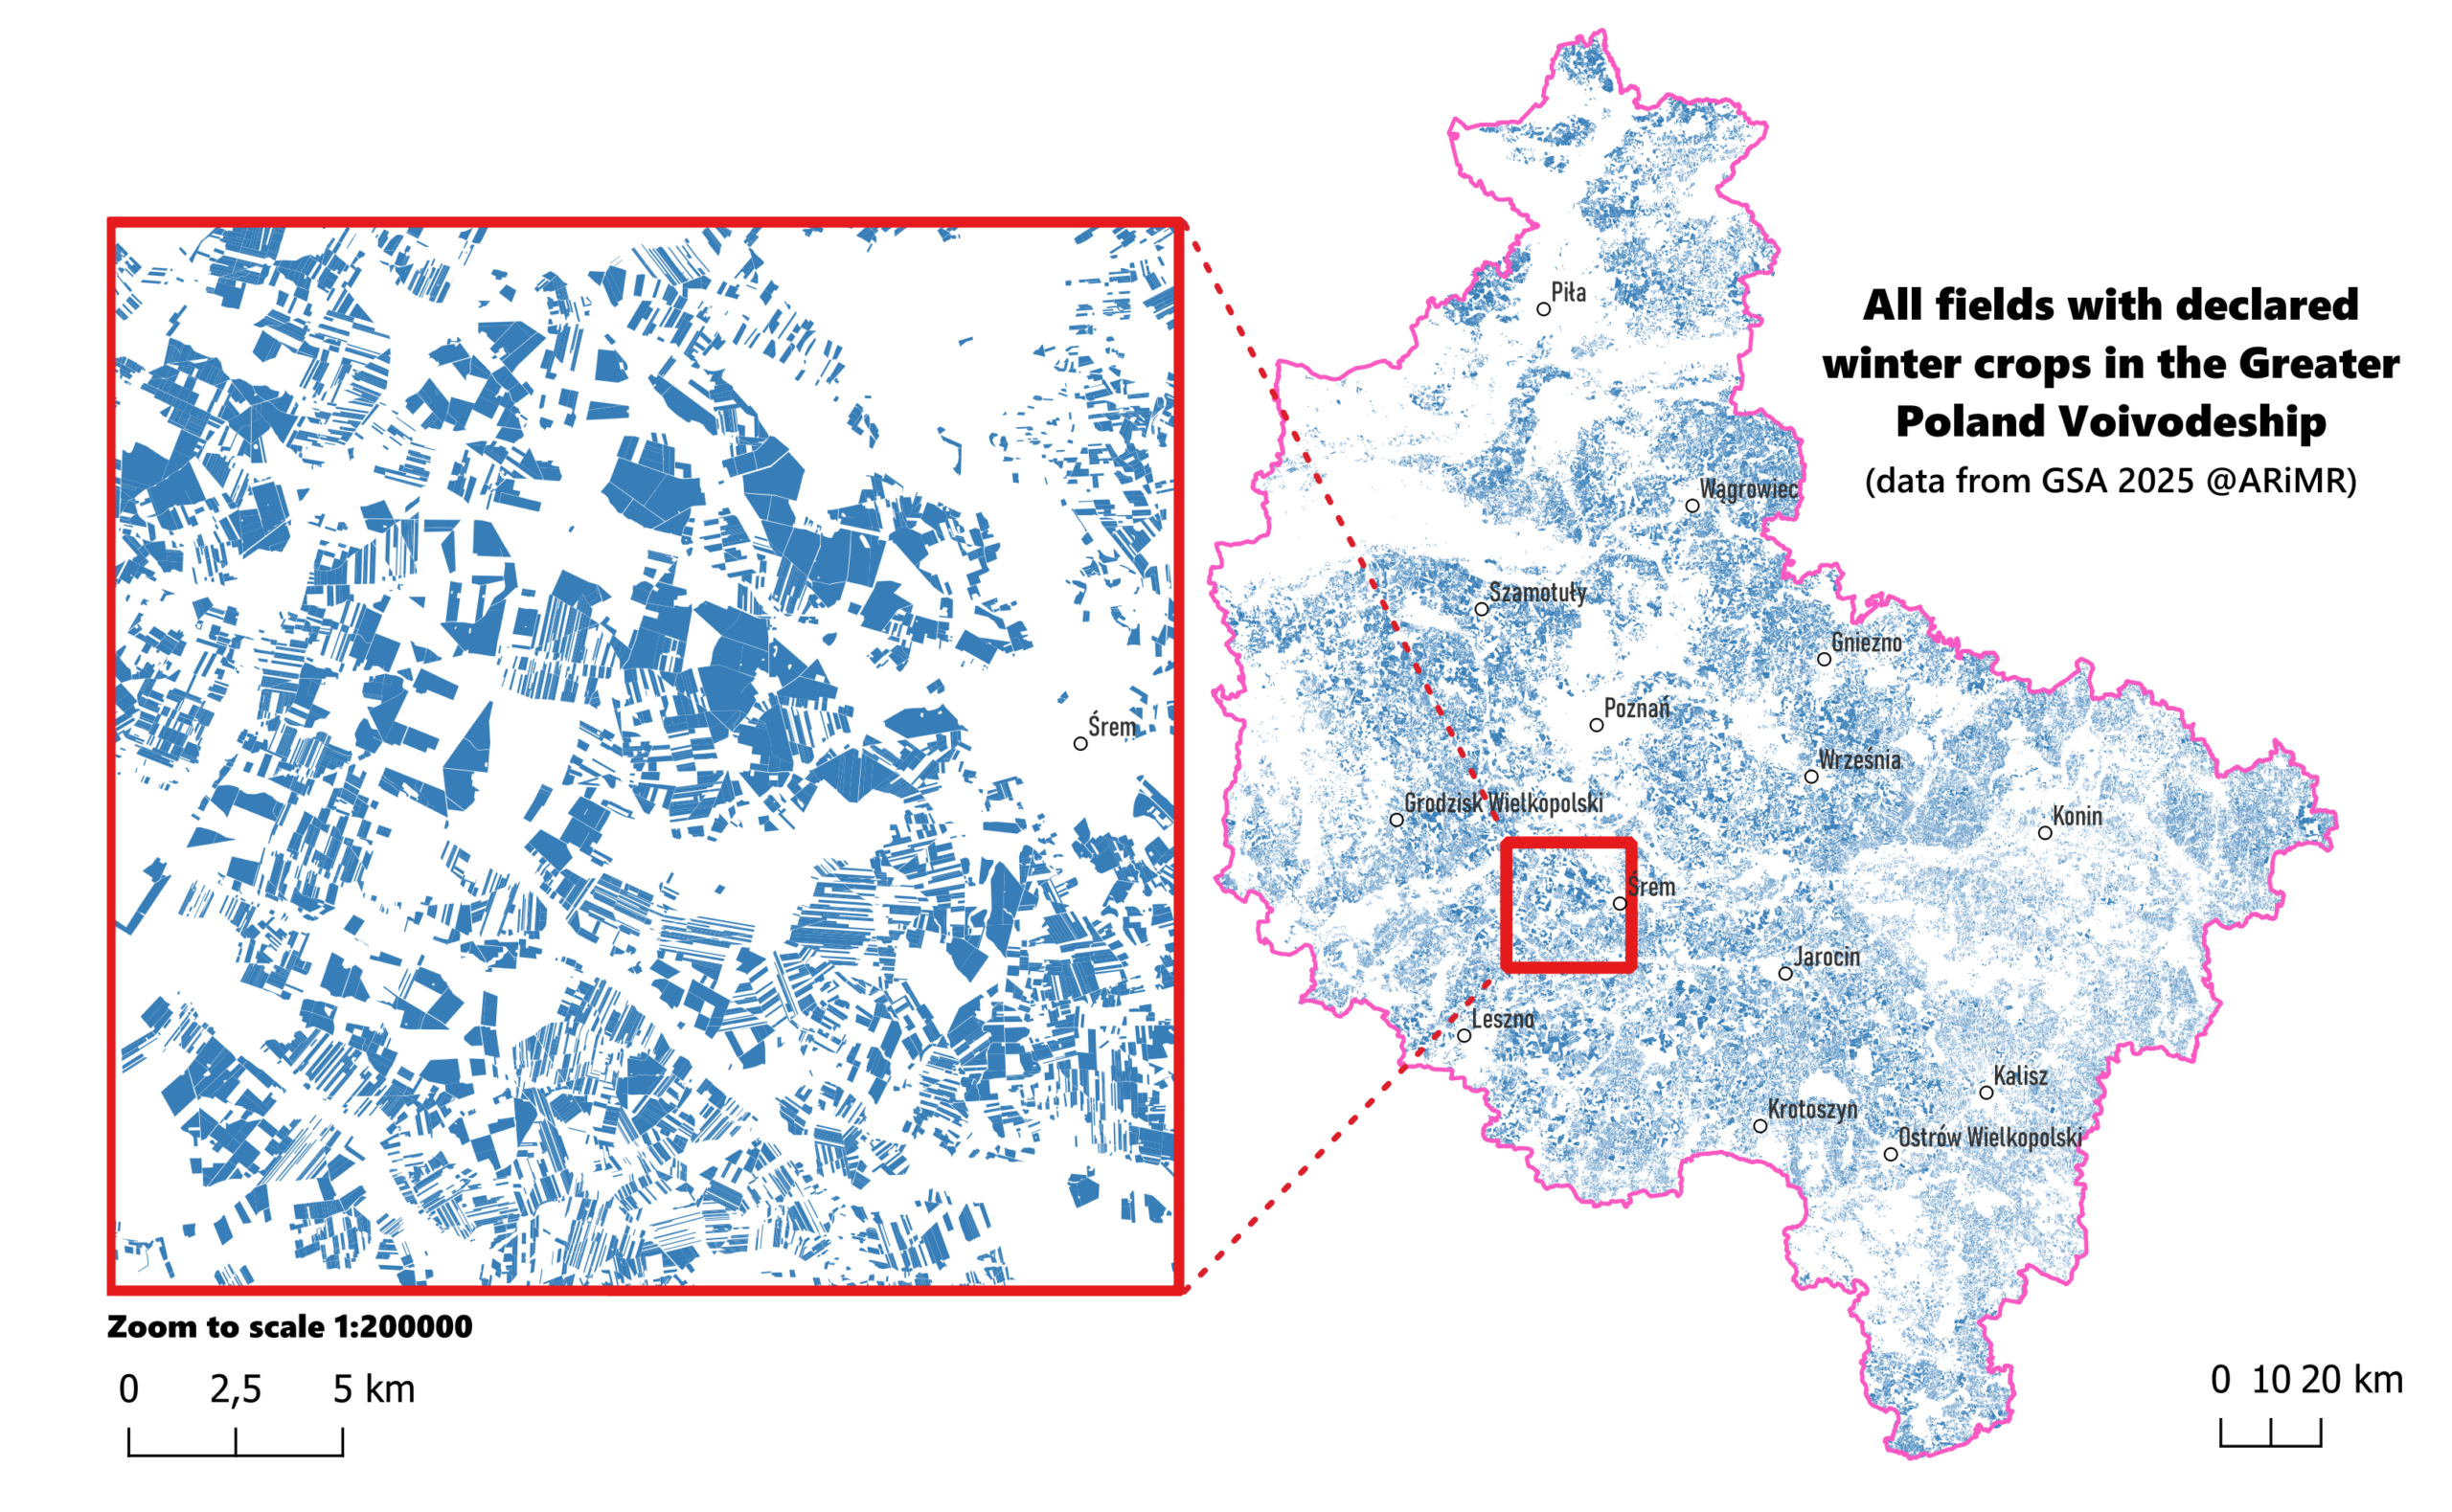
At the Institute of Geodesy and Cartography, research is being carried out on monitoring the winterkill risk of winter crops. The use of crop type information makes it possible to automatically identify areas covered by winter crops and assess their potential exposure to frost stress at the national scale.
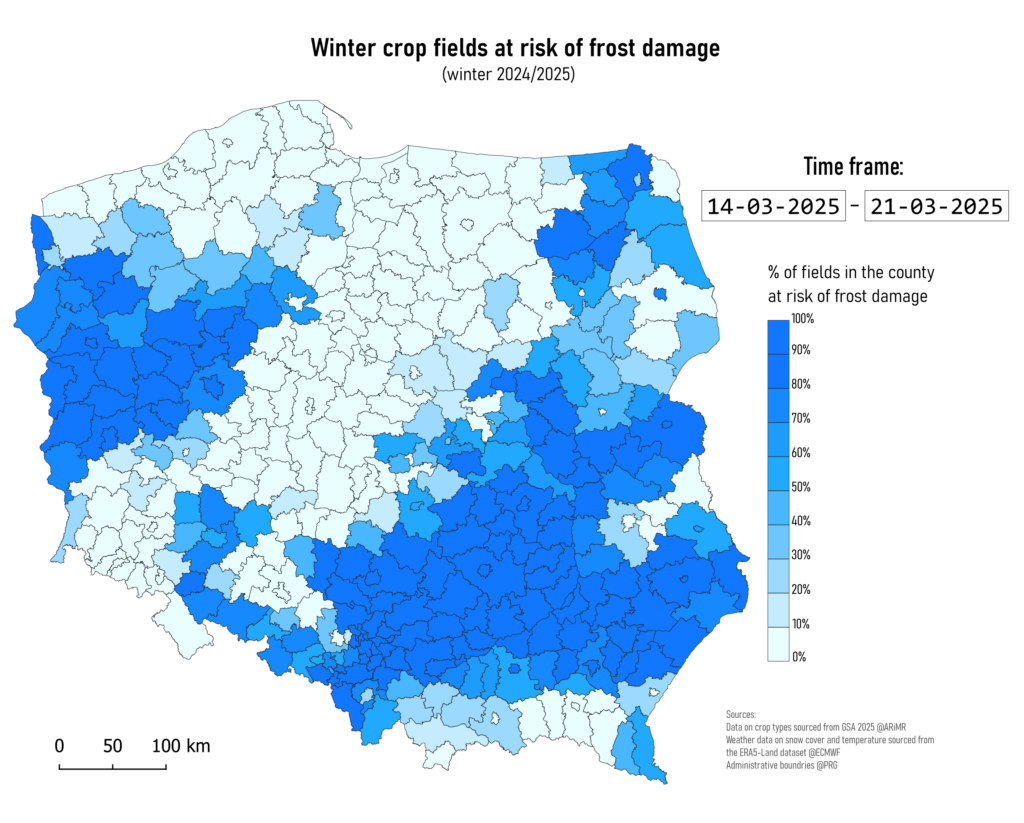
An example application of these data is a cartogram showing the share of winter crops potentially at risk of winterkill in individual counties. Importantly, the map presents the risk of winterkill rather than actual crop damage. The analysis was prepared for the 2024/2025 winter season using available crop structure data together with ERA5-Land dataset meteorological data related to temperature and snow cover. For each agricultural field, conditions potentially conducive to frost damage were evaluated, and the proportion of threatened areas was then summarized for each county. Below is an example map of winter crops at risk of winterkill for the period 14–21 March 2025.