GMES - Geoland 2

GEOLAND2 - towards operational GMES Land Monitoring Core Service
The goal of Geoland2 project is to prepare, validate and demonstrate pre-operational service chains and products that will underpin the Land Monitoring Core Service (LMCS) , and to propose and demonstrate a concrete functional organisation of the LMCS.
The architecture of Geoland2 project is made of two different layers, the Core Mapping Services (CMS) and the Core Information Services (CIS). The CMS produce 'basic' land cover, land cover change, and land state products which are of broad generic use and can be directly used for deriving more elaborated products. The CMS products cover a wide variety of thematic content, spatial scales from local to global, and update frequency, from 1 day to several years. The CIS are a set of thematic elements that start from CMS products and other data sources to produce elaborated information products addressing specific European policies.
Three Core Mapping Services (CMS) within Geoland2 are:
- Land Cover and Land Use - EUROLAND
- Biogeophysical Parameters - BioPar
- Seasonal and Annual Change Monitoring - SATChMo
Seven Core Information Services (CIS) are included within Geoland2 project, namely:
- Spatial Planning
- Water
- Agri-Environment
- Forest
- Land Carbon
- Global Crop Monitoring (GCM)
- Natural Resource Monitoring in Africa (NARMA)
Institute of Geodesy and Cartography (IGiK) actively participates in development of three Geoland2 services: SATChMo, BioPar and Global Crop Monitoring.
SATCHMO AFS Europe (Seasonal and Annual Change Monitoring Core Mapping Service)
 The aim of SATChMo AFS Europe Project is to prepare semi-automatic method for land cover mapping with the use of Very High Resolution (VHR) satellite images and to produce land cover maps for the selected, representative regions of Europe. The second goal is to create method for detecting land cover changes, based on analysis of multi-temporal VHR satellite images.
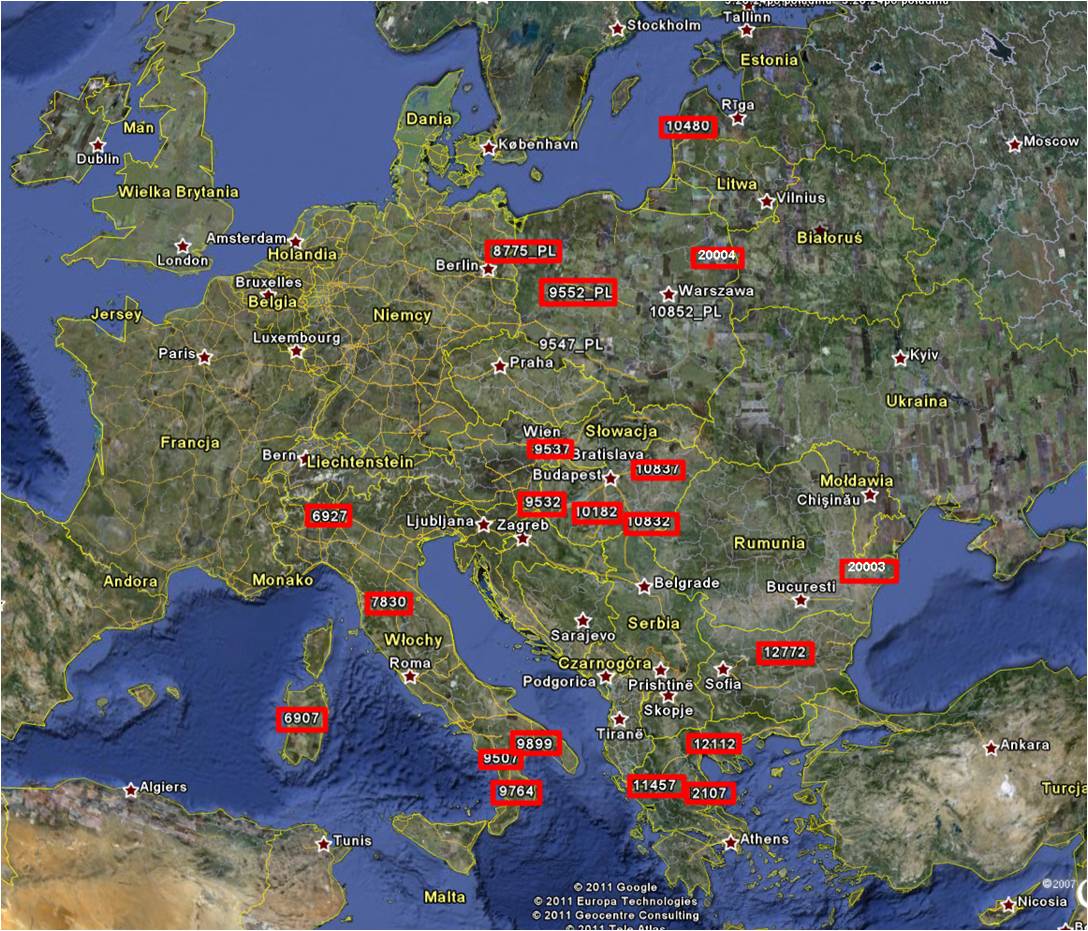
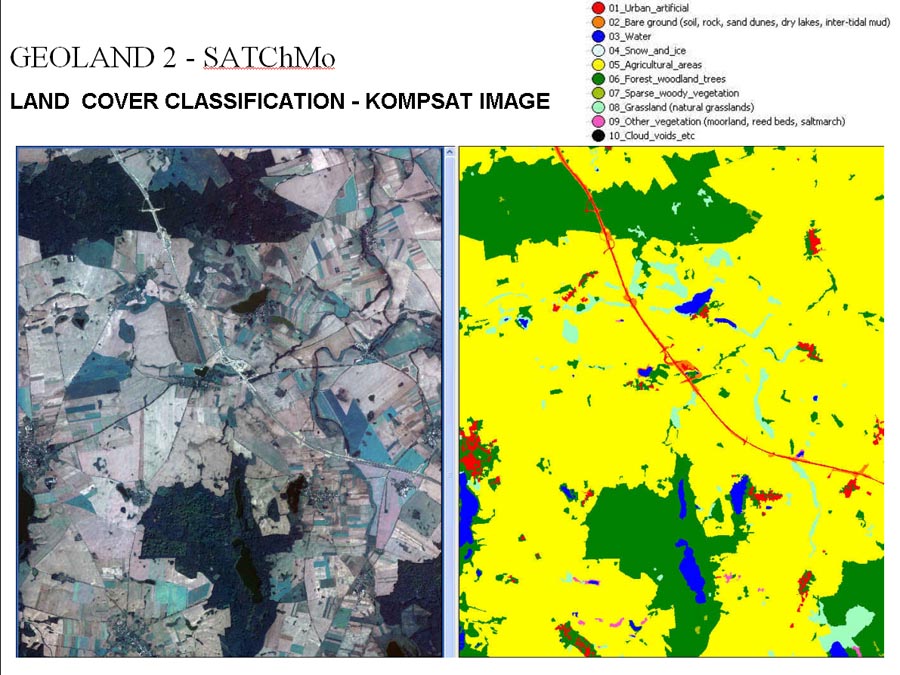
In the course of the project representative areas were selected statistically, using Area Frame Sampling (AFS) method. Institute of Geodesy and Cartography – Department of Remote Sensing has carried out research works, which finally resulted in preparation of algorithm for land cover classification based on VHR satellite images in eCognition environment. Classification method is based on using spectral and textural features for determining main land cover categories (10 classes) “Architect” interface was used for algorithm implementation; it enables to pass classification process in a friendly way. The manual for utilizing classification algorithm has been prepared. Applying the prepared algorithm classification of Kompsat and Formosat images for the selected 20 regions in Europe has been done at the Department of Remote Sensing.
The second task within SATChMo AFS Europe was concentrated on preparation of the method for detecting changes in land cover. Algorithm for change detection has been created within eCognition environment and implemented for producing land cover change maps at ten selected regions of Europe.· The manual for utilizing· change detection algorithm has been prepared.
Within the SATCHMo project the following topic was realized “ Indicators of environmental diversity derived from generic land cover products based on VHR satellite images”.
As the environment is very complex and highly dynamic, indicators provide a more appropriate way to track its state than if it were attempted to record every possible variable in the environment individually. Spatial indicators, or landscape metrics, provide a means of characterising a region by summarising the location and distribution of features in the landscape. Landscape metrics can play an important role in the investigation, evaluation and monitoring of landscape structure, which has known linkages to biodiversity. For instance, fragmentation of natural habitat features is detrimental to biodiversity and can be assessed by indicators which summarise the distribution and patch size of key habitats. Changes in indicators over time can capture import environmental trends or the response of the landscape to changing environmental policy. Indicators have a range of uses from measures of biodiversity to estimates of risk.
Following indicators were calculated:
- metrics of landscape fragmentation: Patch Density, Edge Density
- metrics of differentiation of land cover types: Patch Richness, Simpson Diversity Index
- metrics of contribution of natural and semi-natural classes: Natural Patch Richness, Percent of Natura Landscape, Mean Natura Patch Area
- lanscape indicators to change monitoring-SEBI (Streamlining European Biodiversity Indicators): SEBI 4, SEBI 13
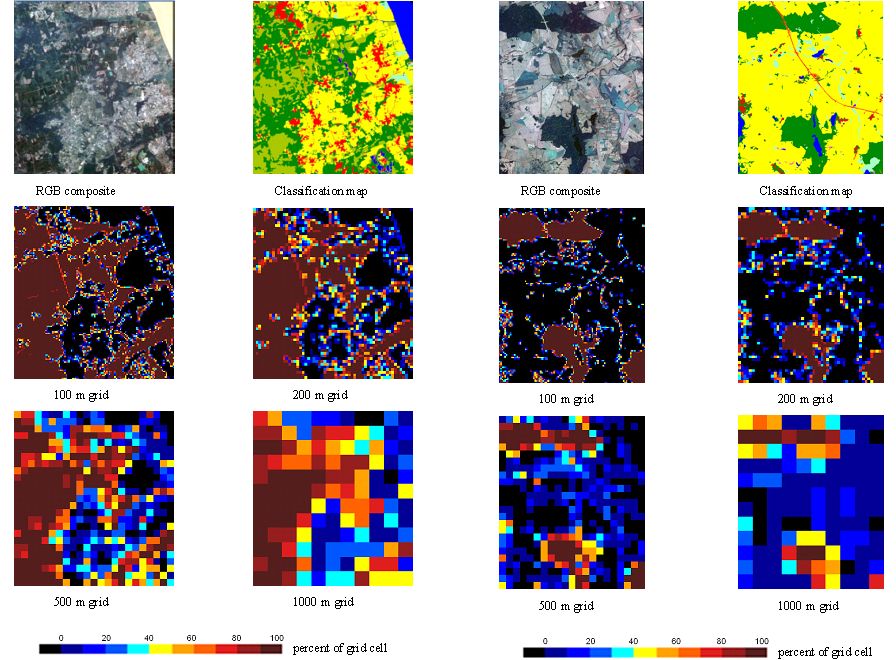
The works have been conducted on two test areas located in sounthwestern France (more heterogeneous) and northwestern Poland. The analysis was done for 4 dimensions of grid: 100, 200, 500 and 1000 m.
BioPar (Biogeophysical Parameters Core Mapping Service)
Within Global Crop Monitoring module Institute of Geodesy and Cartography conducts works related to inter-comparison of various methods for estimating crop acreages and yields in global / regional scale, which are based on multi-temporal remote sensing derived information.
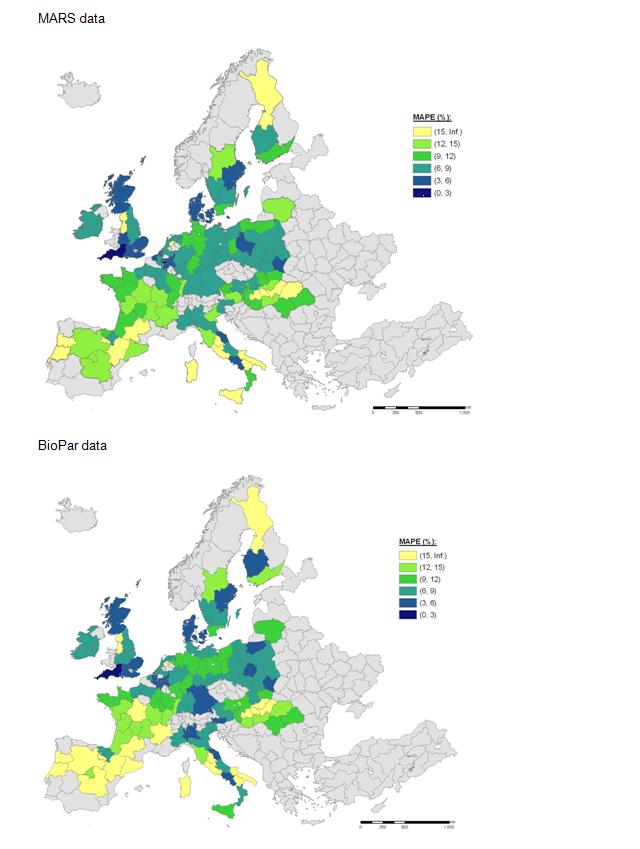
Within BioPar module Institute of Geodesy and Cartography is involved in the works aimed at development of methods of vegetation monitoring with the use of different indices derived from medium-resolution satellite images. Within Coordination Office of Geoland2 project the Institute of Geodesy and Cartography performs tasks related to harmonization of validation approaches applied in various modules of the Project.
GCM (Global Crop Monitoring Core Information Service)
For Geoland2 CIS CROP module leaflet see below: