Agricultural drought in year 2019
Moisture conditions of agricultural crops in 2019
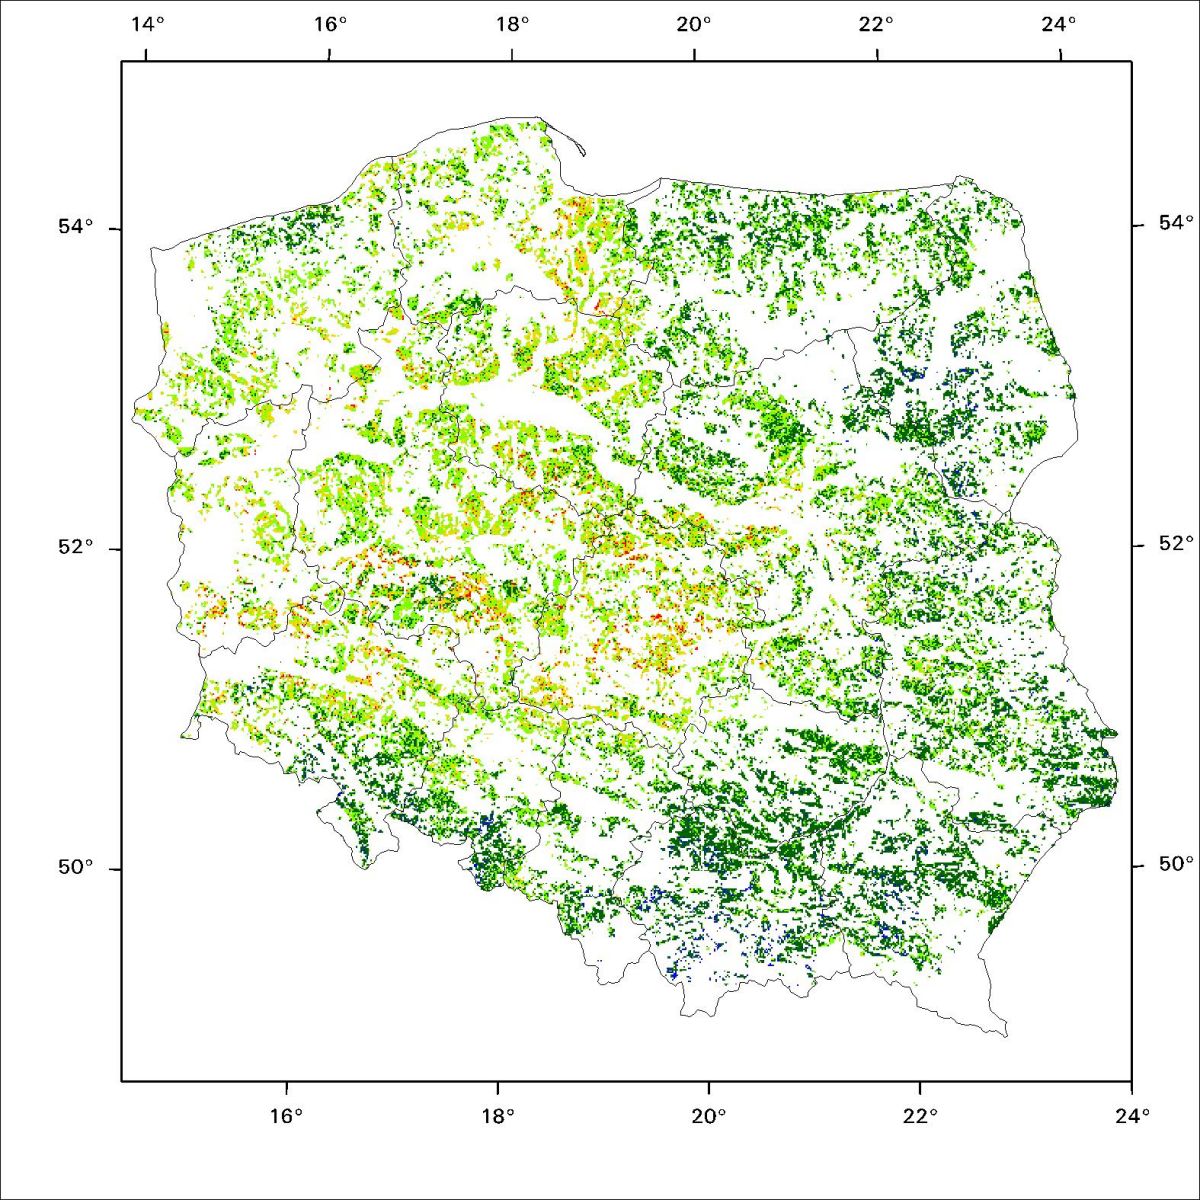
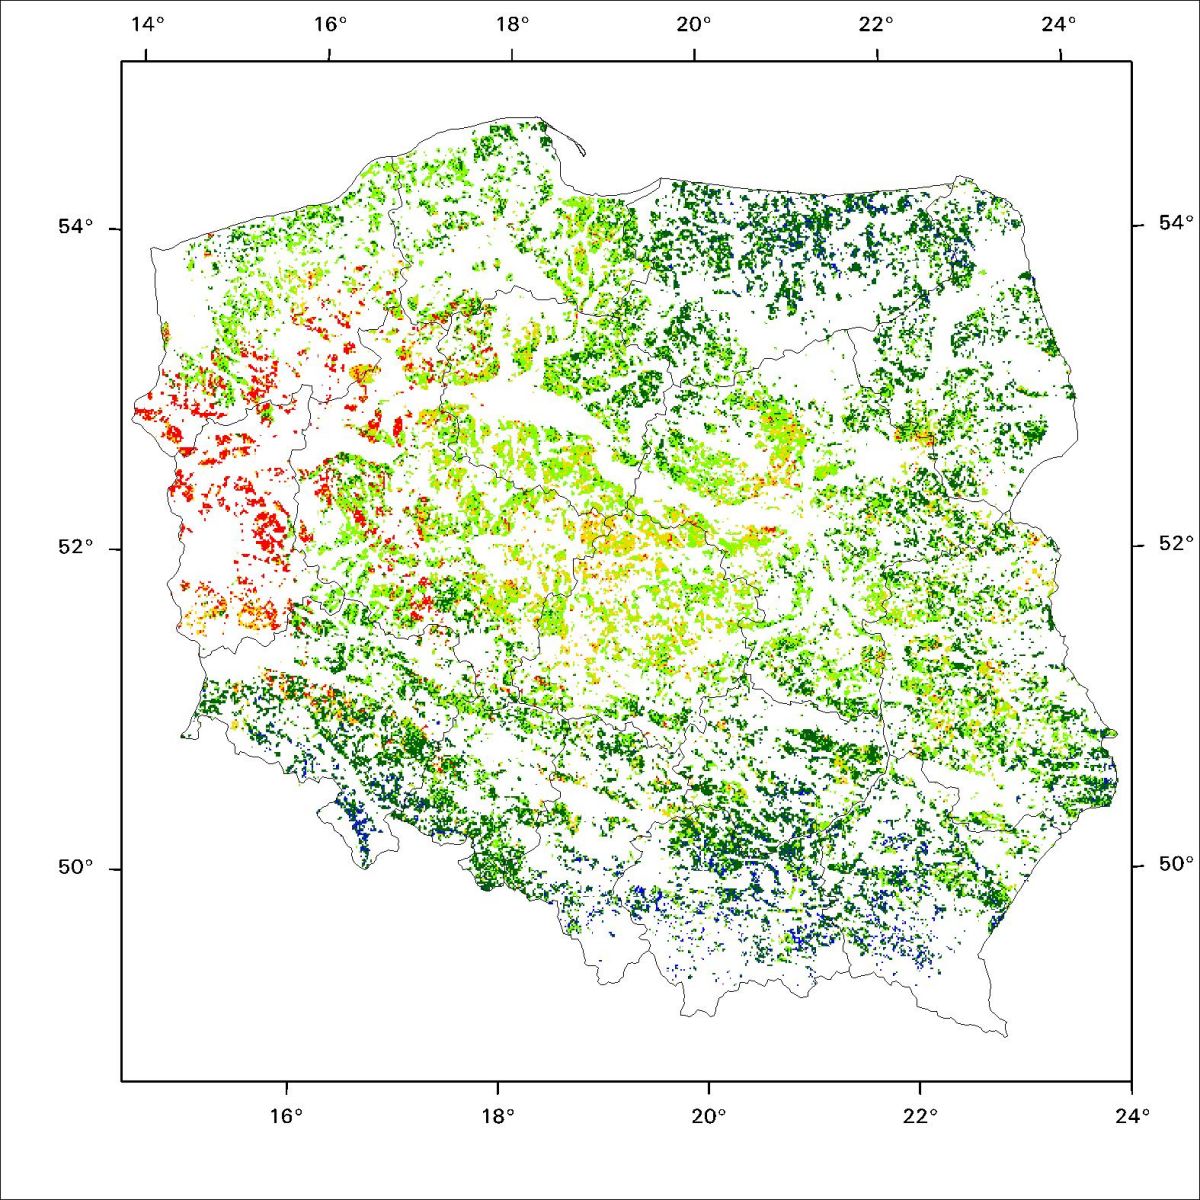
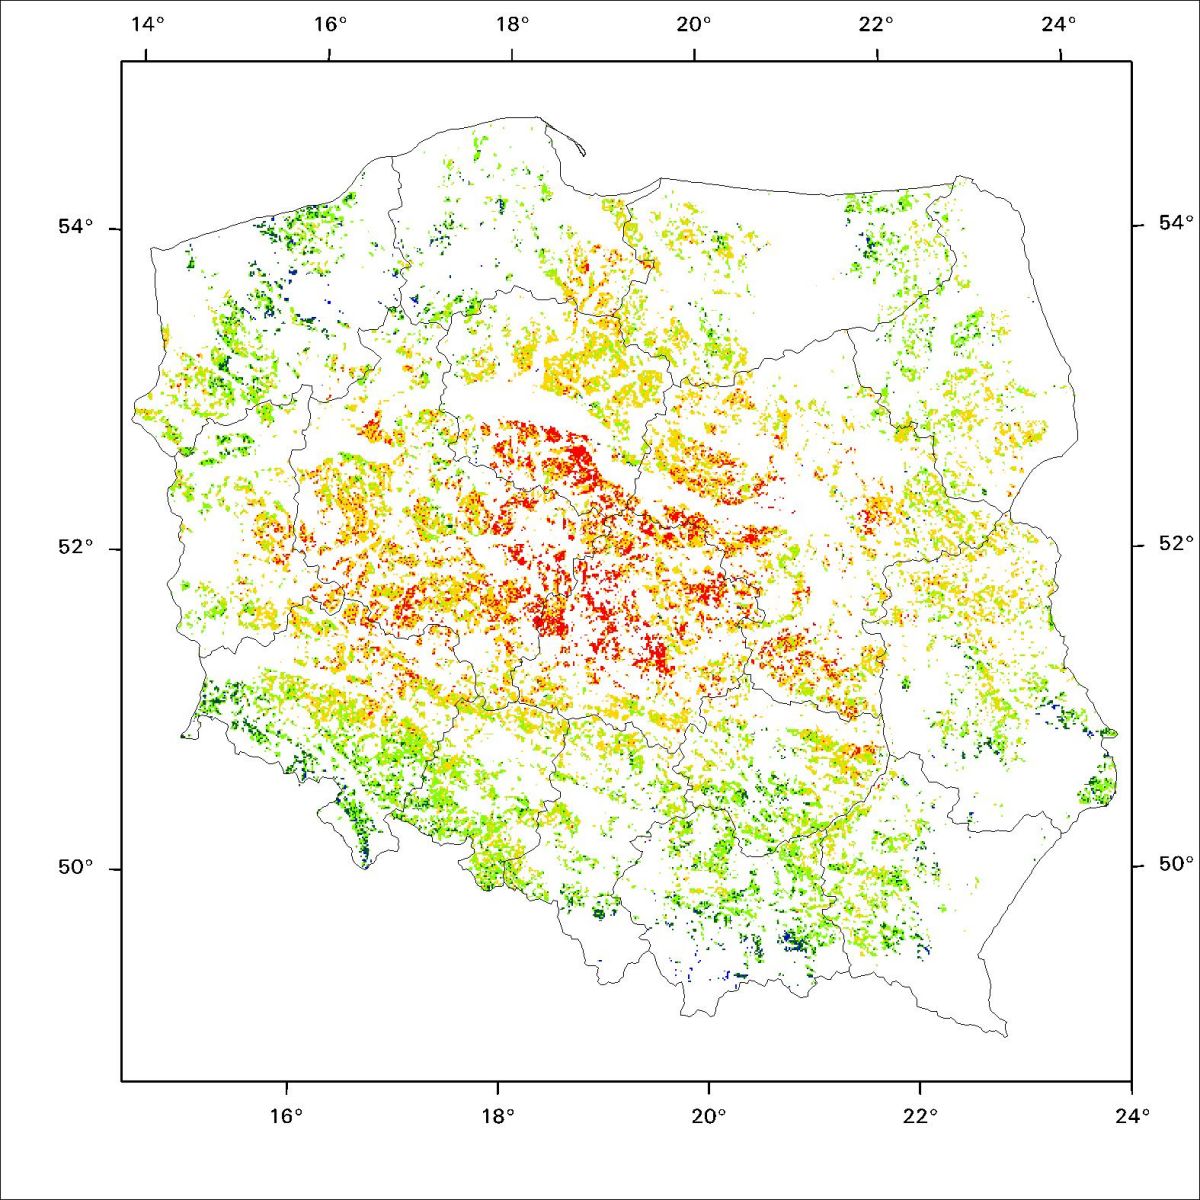
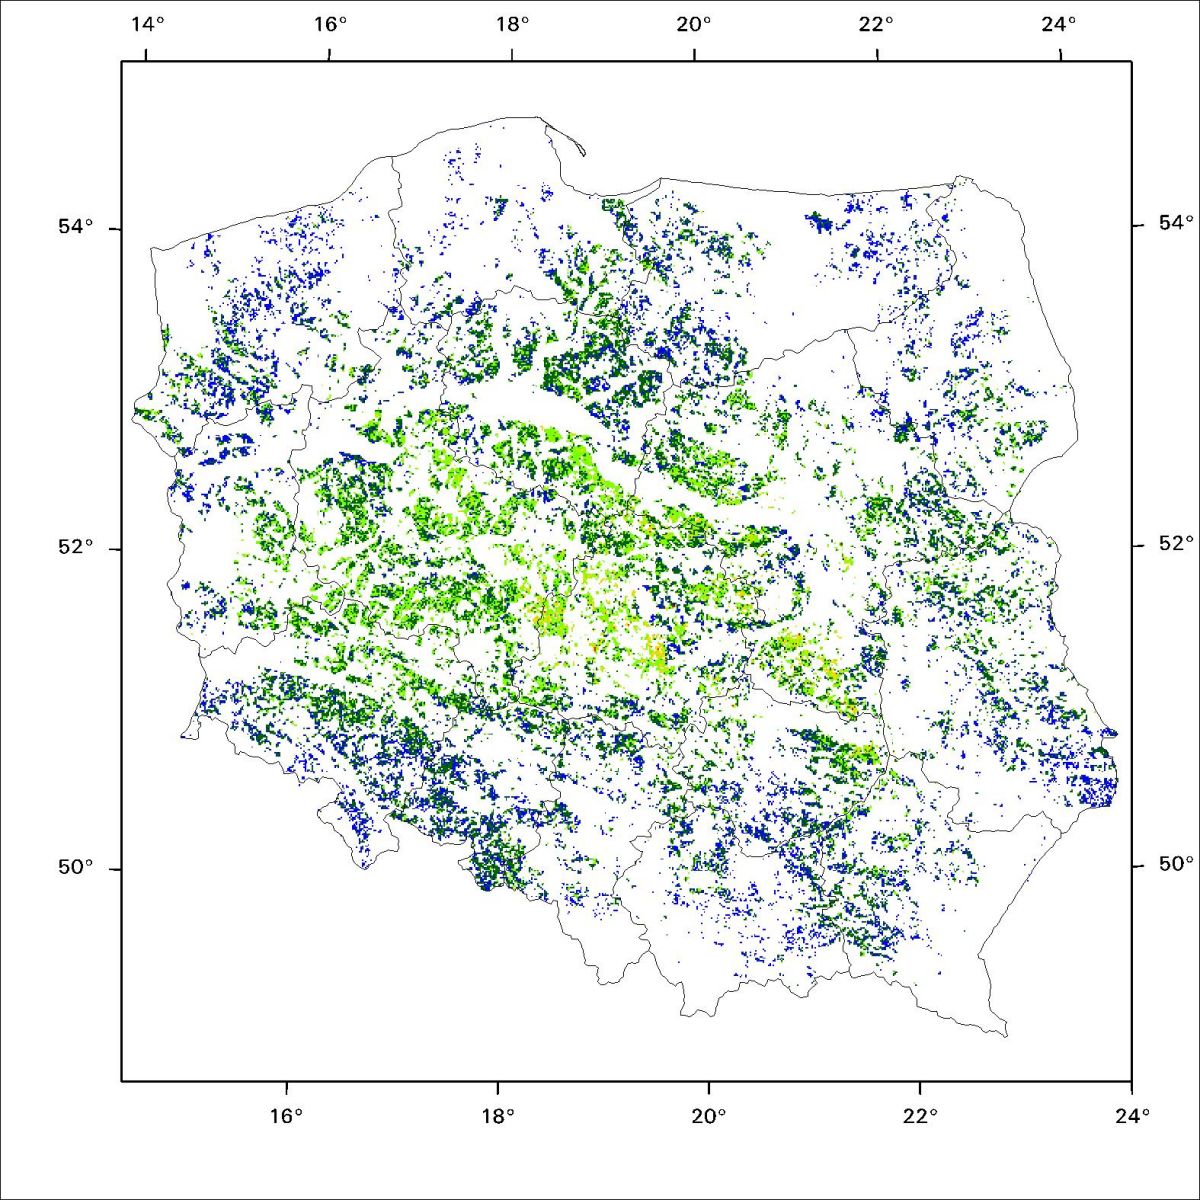
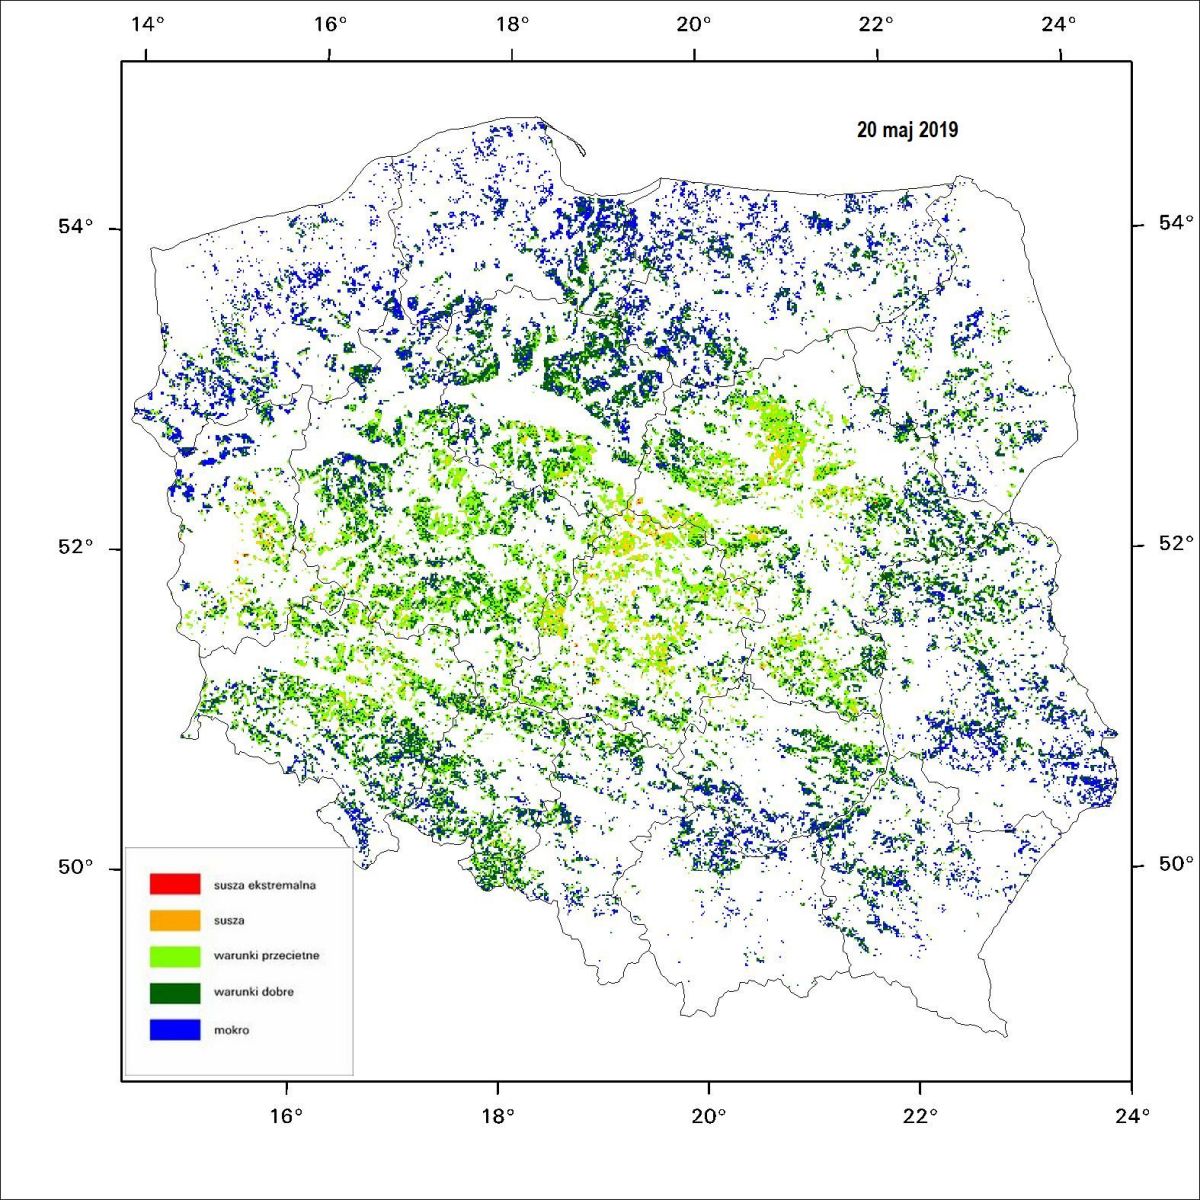
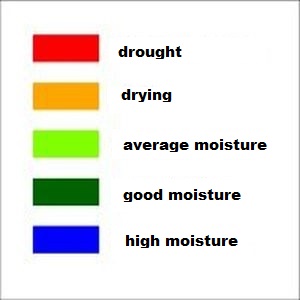
The maps presented below demonstrate various moisture conditions of crop development based on Temperature Condition Index (TCI), marked with various colours:
- heavily threatened with drought - red
- threatened with drought - orange
- average conditions - light green
- good conditions - dark green
In addition, dark blue denotes areas with excessive plant moisture, which in combination with low air temperature at the start of vegetation season can cause ground frosts. The maps are produced since the beginning of May.
 |
 |
| dekad 24 (21 - 31 of August) 2019 | dekad 23 (11 - 20 of August) 2019 |
 |
 |
| dekad 22 (1 - 10 of August) 2019 | dekad 21 (21 - 31 of July) 2019 |
 |
 |
| dekad 20 (11 - 20 of July) 2019 | dekad 19 (1 - 10 of July) 2019 |
 |
 |
| dekad 18 (21 - 31 of June) 2019 | dekad 17 (11 - 20 of June) 2019 |
 |
 |
| dekad 16 (1 - 10 of June) 2019 | dekad 15 (21 - 31 of June) 2019 |
 |
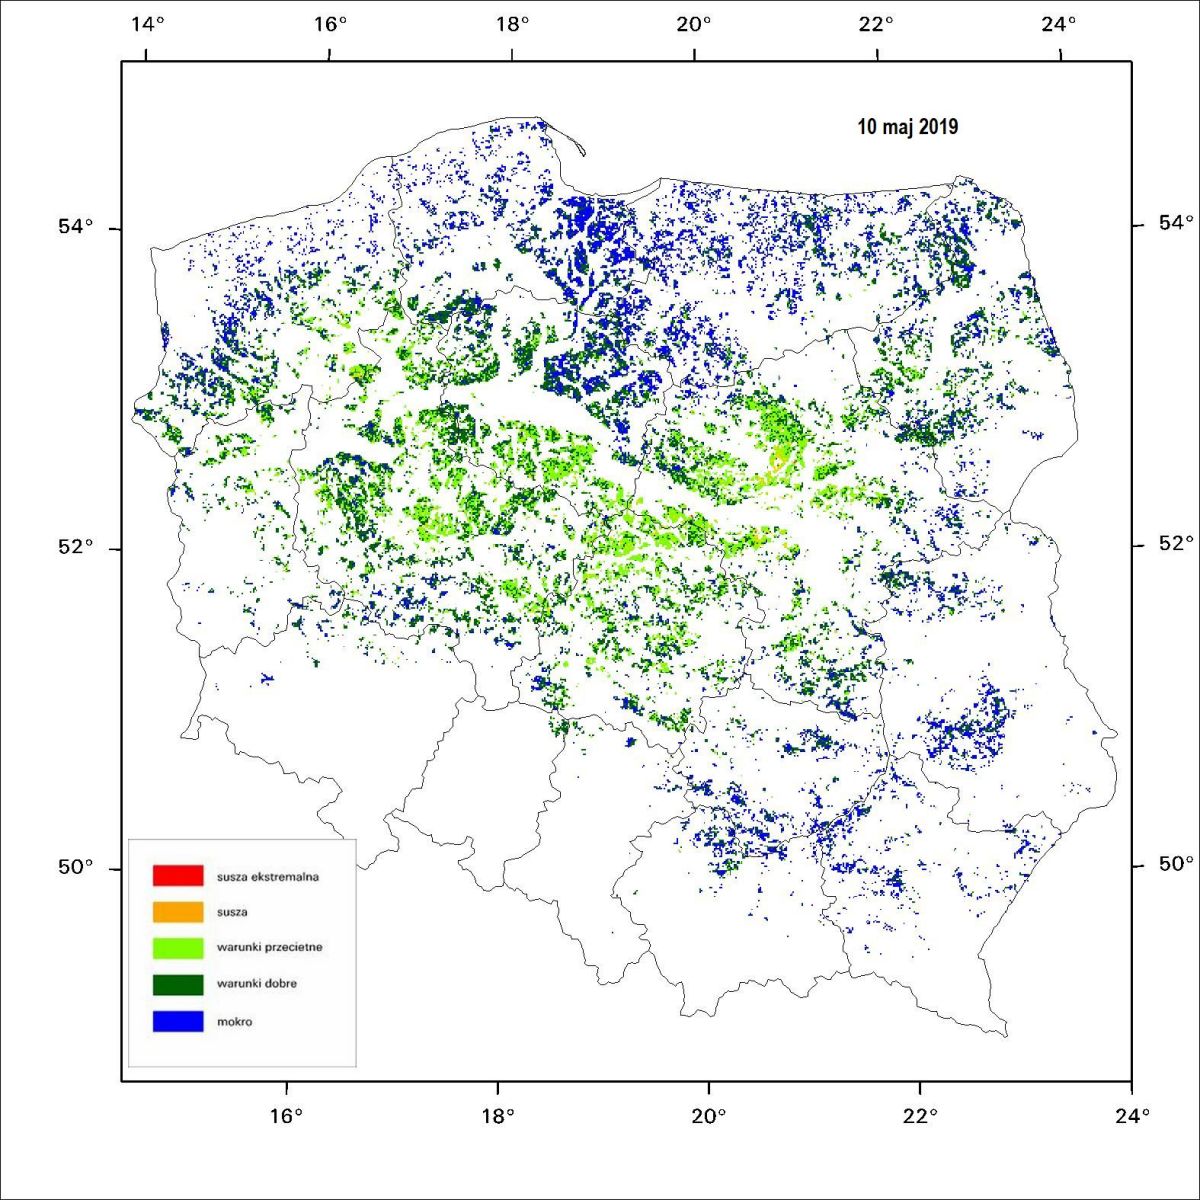 |
| dekad 14 (11 - 20 of May) 2019 | dekad 13 (1 - 10 of May) 2019 |
 |