MS.MONINA - Service for Monitoring NATURA 2000 Habitats

MS.MONINA Multi-scale Service for Monitoring NATURA 2000 Habitats of European Community Interest
Project leader: Dr. Eng. Zbigniew Bochenek
Project duration: 2010 – 2013
The aim of the project was to create a service for monitoring NATURA 2000 habitats with the use of various remote sensing data. The service was built at three levels: European, national and local level. 17 units representing the research institutions, enterprises and end-users participated in the project.
The project has been organized in the form of 8 workpackages:
WP 1 – Project management
WP 2 – Emerging user/service provider’s networks and user validation
WP 3 – MS.MONINA EU
WP 4 – MS.MONINA State
WP 5 – MS.MONINA Site
WP 6 – Common toolbox and data access
WP 7 – Inteoperability and MS.MONINA Spatial Data Infrastructure (SDI)
WP 8 – Dissemination and exploitation of MS.MONINA products and services
Remote Sensing Centre of the Institute of Geodesy and Cartography participated in three work packages. At first phase of the works the database was created, which included tools and methods so far applied by various members of project consortium for monitoring protected areas. At the second stage information concerning needs of the end-user (Biebrza National Park) related to the use of remote sensing based products, was collected. At the main part of the project the research works were conducted, aimed at improvement of semi-automatic methods for wetland’s classification and for defining the effective methods of monitoring wetland’s changes.
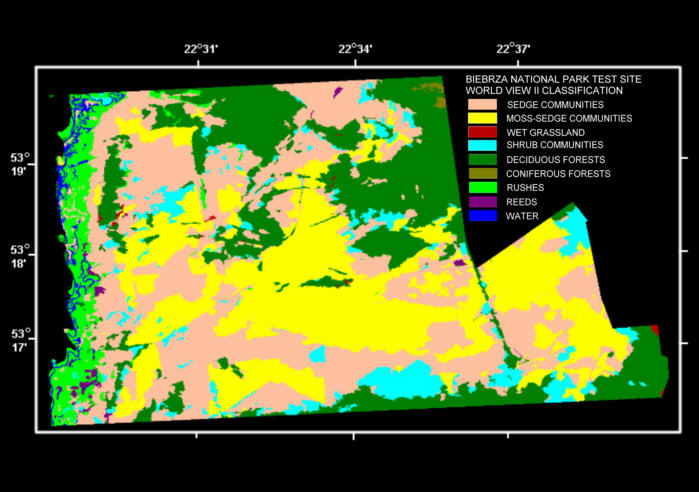
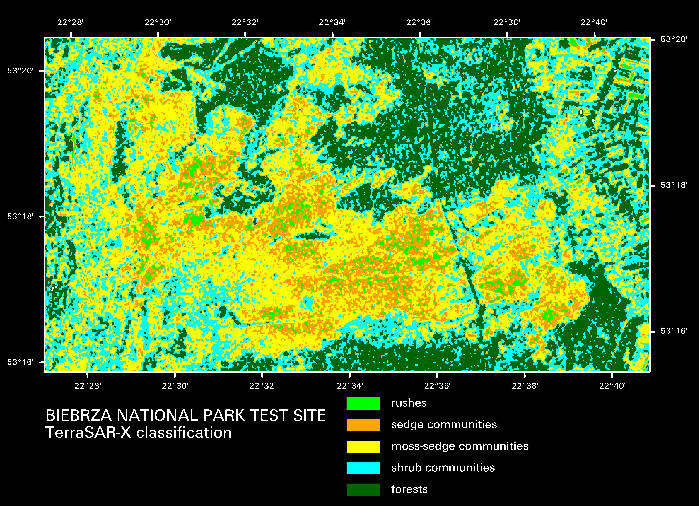
As a result of these works the methods for classifying wetland vegetation with the use of high-resolution satellite data (WorldView-2) and with the use of radar data (TerraSAR-X) were determined, as well as the approach for monitoring vegetation changes. These methods were based on object-oriented classification using eCognition software (WorldView-2) and on pixel-based classification using ERDAS Imagine software (TerraSAR-X). Object-based classification enabled to distinguish eight classes of wetland vegetation with the average accuracy of 92%.
 |
| Fig. 1. Map of wetland habitats based on VHR optical data. Credits: IGiK |
 |
| Fig. 2. Map of wetland habitats based on radar satellite data. Credits: IGiK |
