Crop growth monitoring and yield forecasting in Poland
In climatic conditions of Poland droughts cause large damages of crops, in turn inducing significant decrease of yields. The drought is the result of disruption of water balance. The disruption is caused by atmospheric drought due to lack of rainfall, soil drought caused by excessive drying of soil and hydrological drought, which causes lowering of water table. In the course of last fifty years of 20th century the most severe droughts appeared in 1951, 1953, 1959, 1963, 1964, 1969, 1971, 1976, 1982, 1988, 1990 and the extreme drought in 1992, which caused yield reduction of winter crops up to 15% and spring crops up to 20%. In 21st century the droughts were noticed in 2000, 2002, 2003, 2006, 2015, 2016, 2018 and 2019.
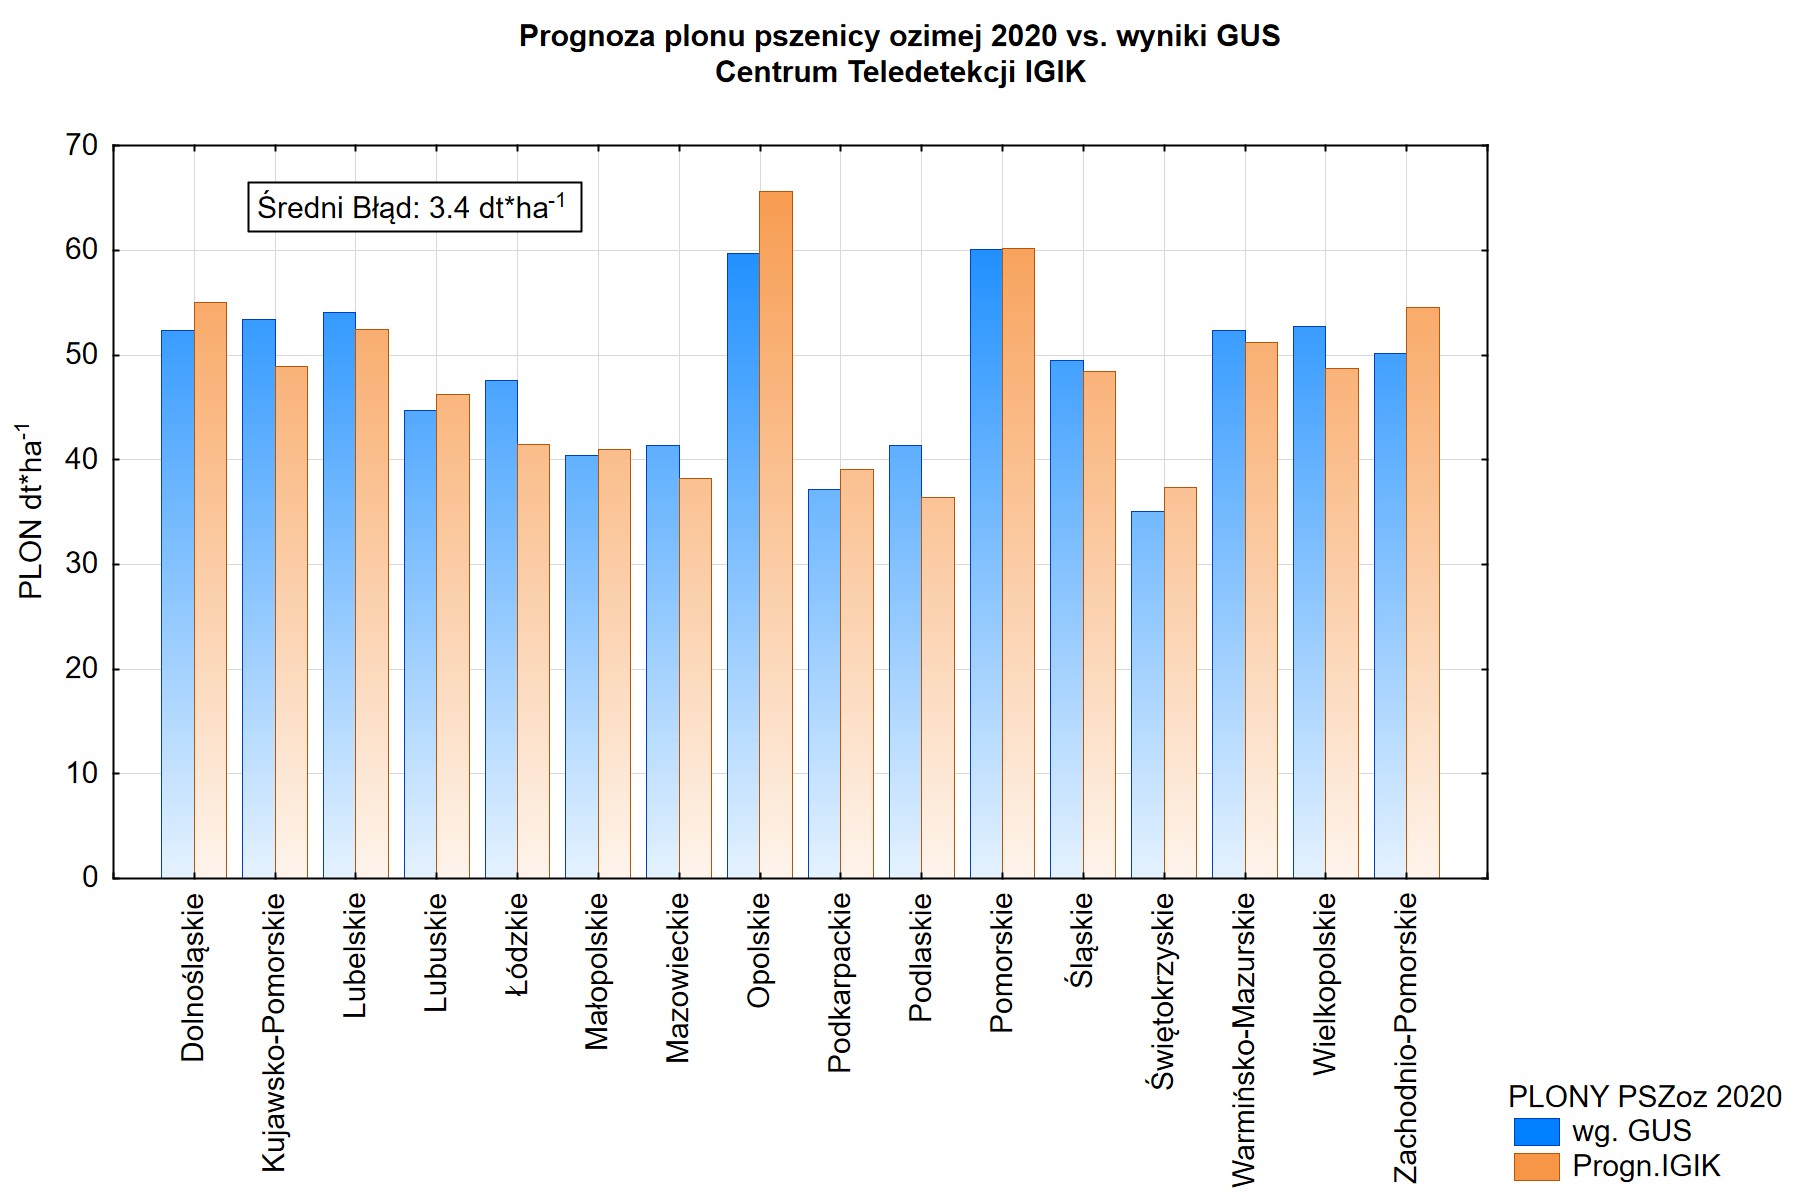
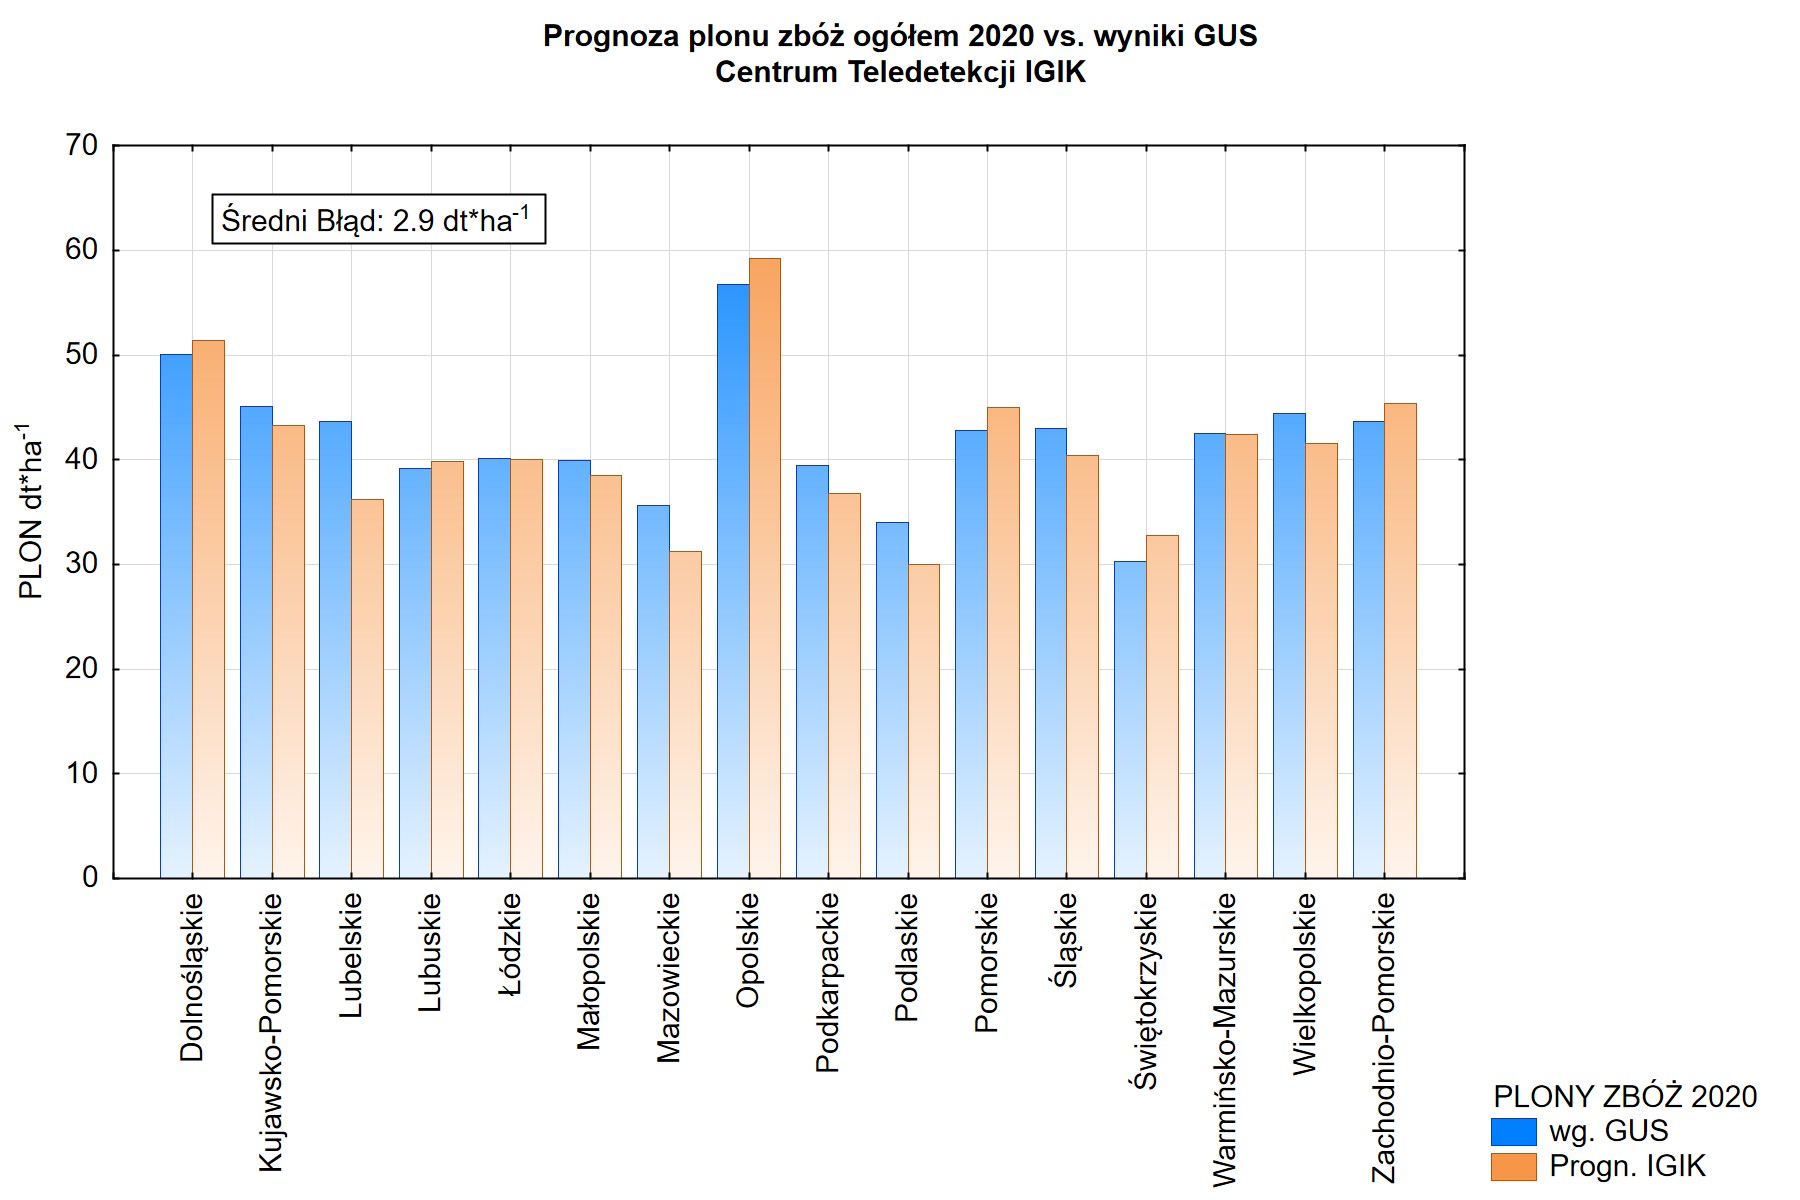
Początek sezonu 2020 dla rolnictwa nie przedstawiał się optymistycznie. Po bezśnieżnej zimie brak opadów który miał miejsce w kwietniu nie był korzystny dla upraw. Maj i czerwiec w pełni to zrekompensował, występujące dość często opady zapewniły dobre uwilgotnienie gleby. Według naszych modeli prognozy plonów zbóż i pszenicy ozimej w bieżącym roku są dobre, średnio o 10% wyższe od ubiegłorocznych. Wykresy słupkowe zamieszczone poniżej dają porównanie naszej prognozy z wynikami GUS.
 |
 |
In 1996 the Crop Growth Condition Assessment System has been implemented at the Remote Sensing Centre in cooperation with the Canada Centre for Remote Sensing. The technology based on using NOAA/AVHRR satellite data conssits of the following stages:
- Capturing NOAA/AVHRR satellite images through the whole vegetation period and their geometric and radiometric processing
- Calculation of NDVI vegetation index on the basis of reflectance recorded in visible and near-infrared bands and generation of 10-day NDVI composites for agricultural areas on the basis of daily images
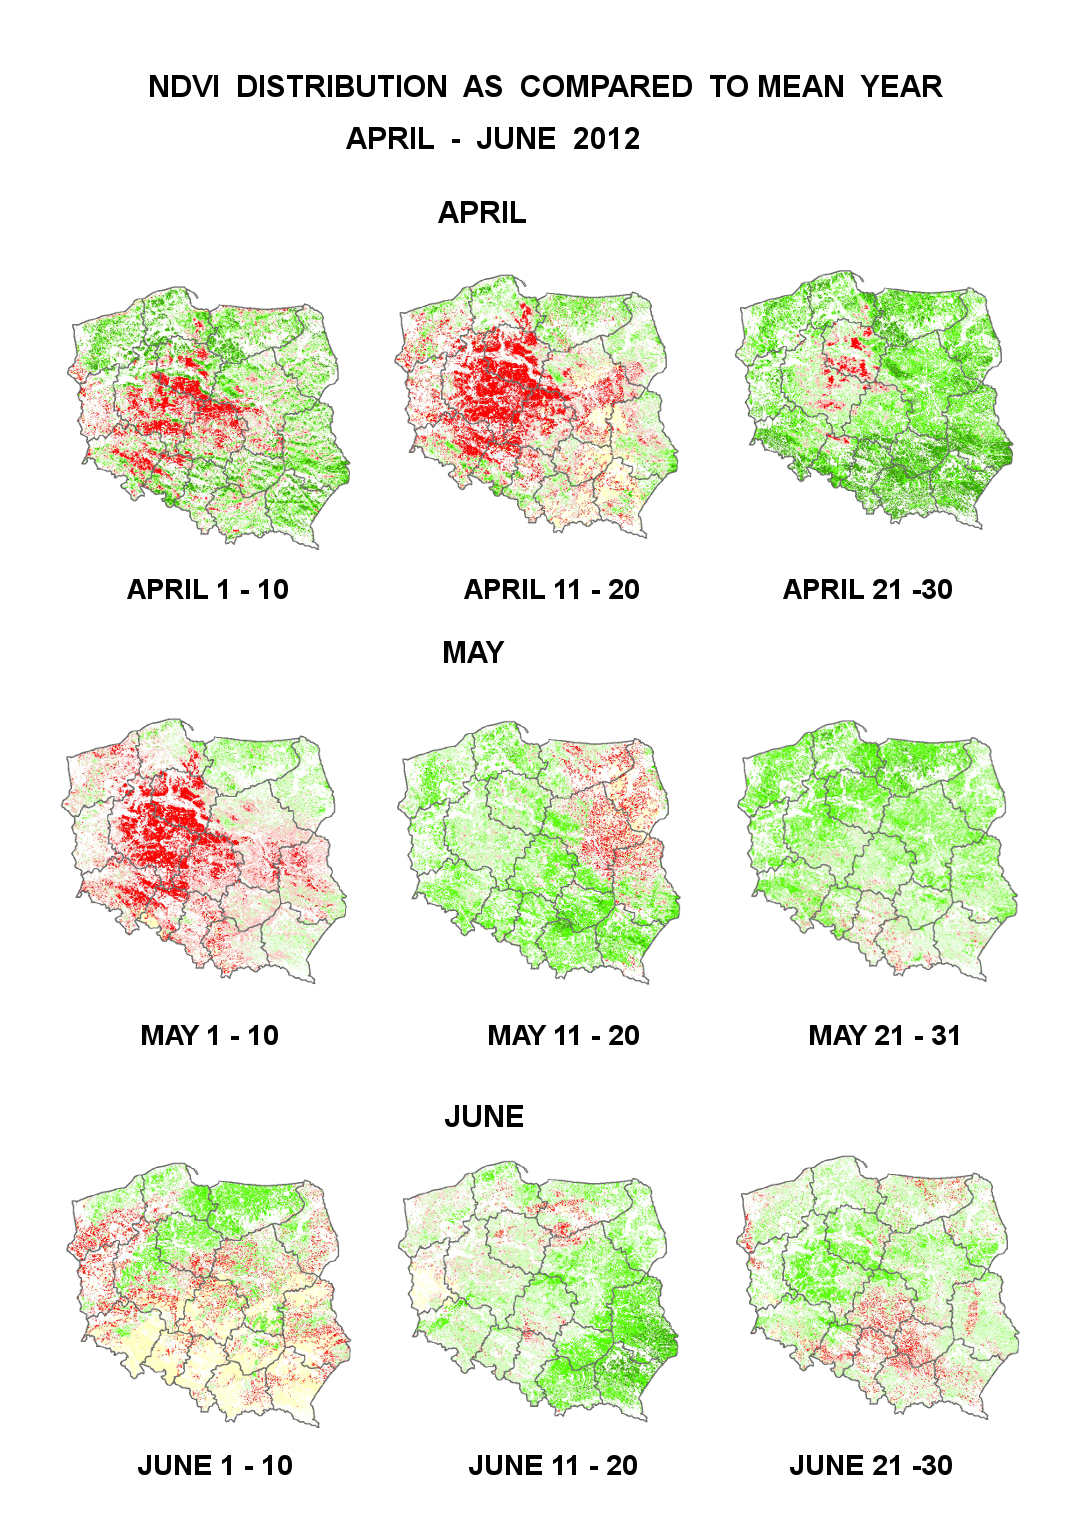
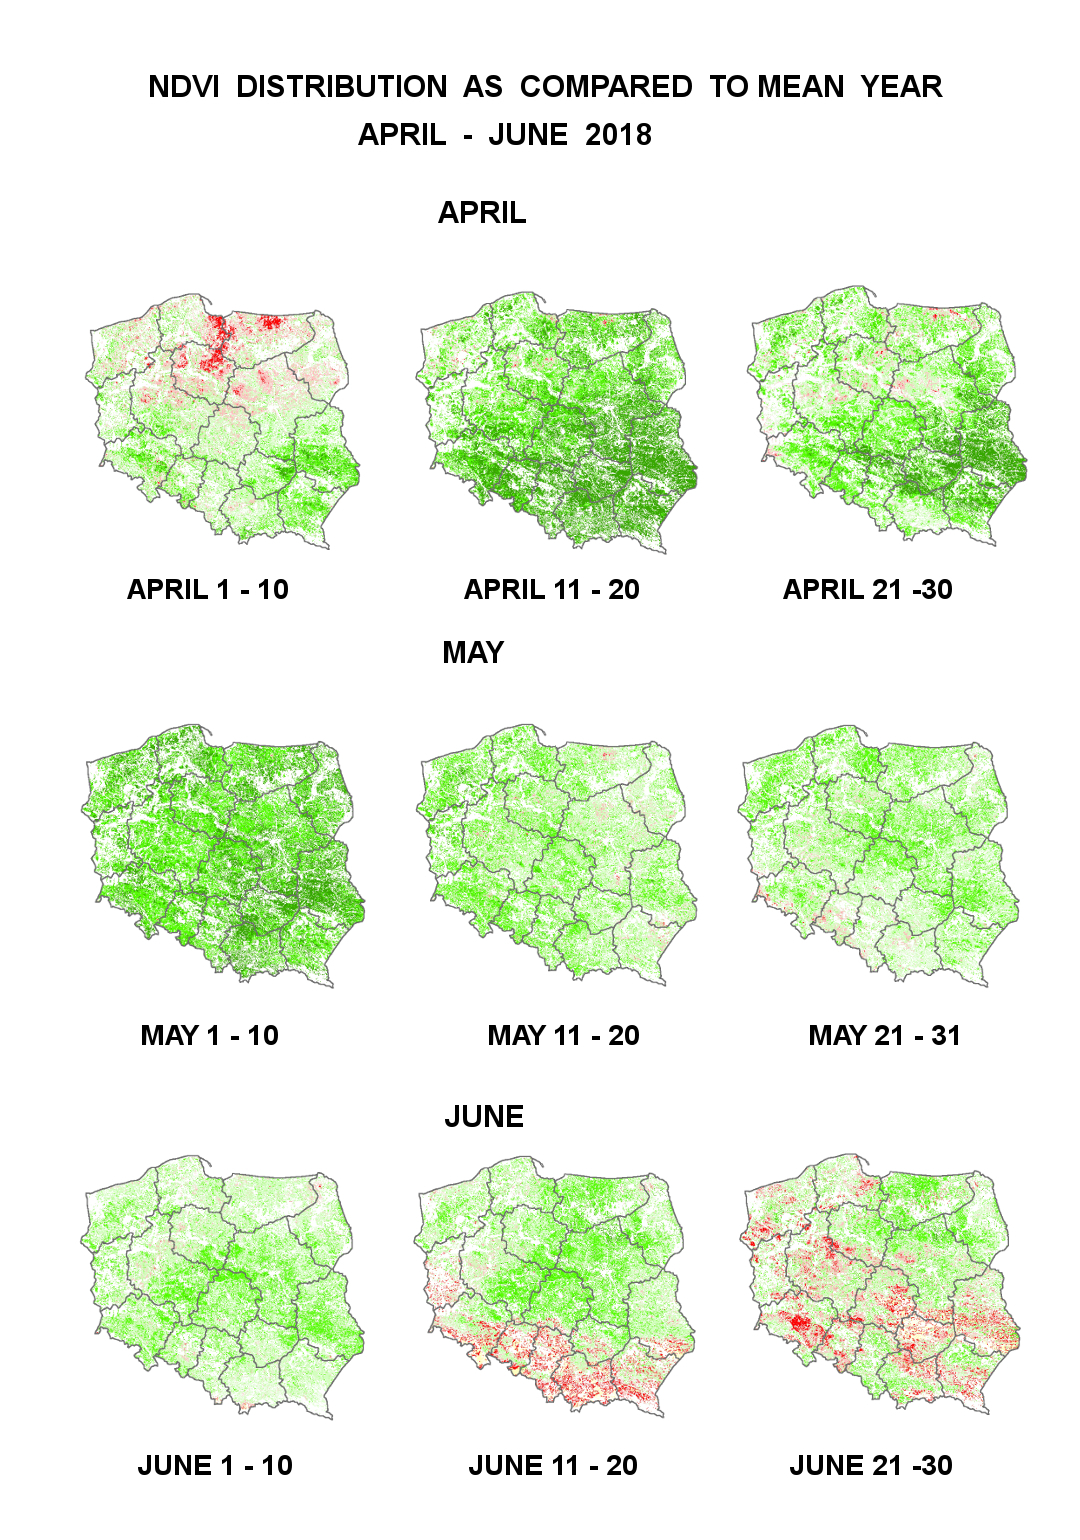
- Preparation of comparative maps of NDVI distribution in relation to mean year and previous year for particular 10-day periods within vegetation season
- Determination of changes of NDVI index through vegetation season characterizing crop development.
Diagram of functioning Crop Growth Condition Assessment System is presented in figure 1.
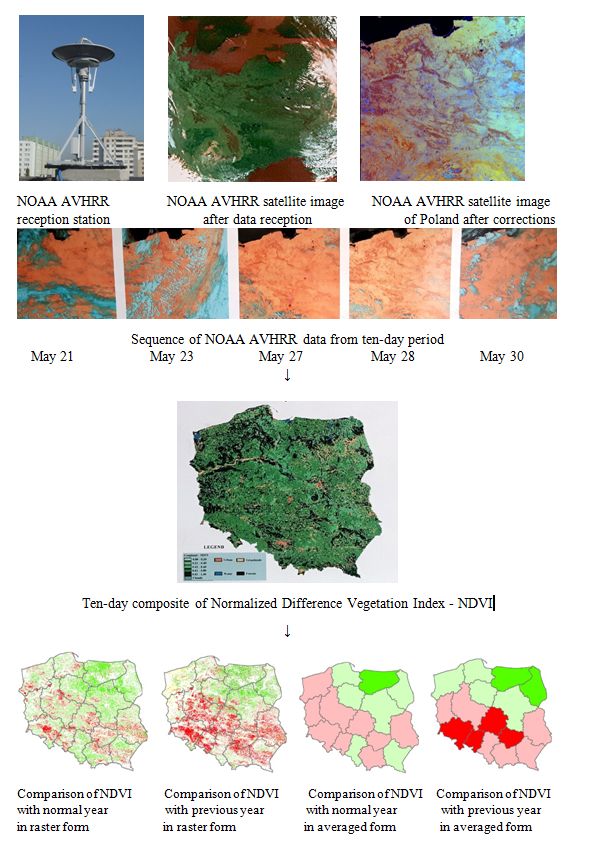
Comparative maps of NDVI index - in relation to normal year and previous year - generated through comparison of current index with archival one existing at the database of the Insttute of Geodesy and Cartography (1997 - 2018), are the final products of the Crop Growth Condition Assessment System. The maps are generated in raster format (1 sq. km) and in the form aggregated to voivodships. Information of the state of crop development is expressed through ratio of the current NDVI index in particular 10-day period and the NDVI index from normal or previous year. The maps are delivered through the whole vegetation season (April 1 - September 30) to the Agricultural Department of the Central Statistical Office. On the basis of information from particular 10-day periods graphs of NDVI changes are produced as well as series of comparative maps through vegetation season.
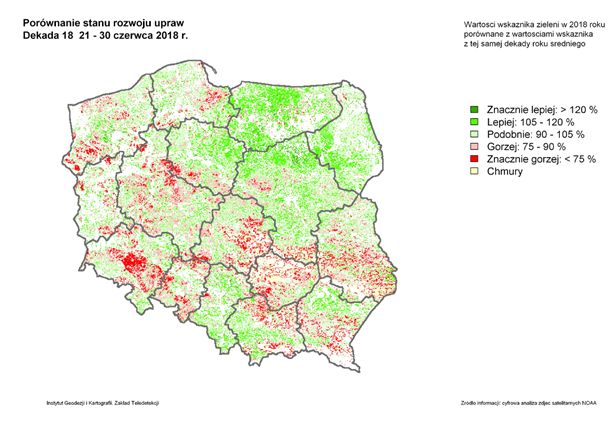
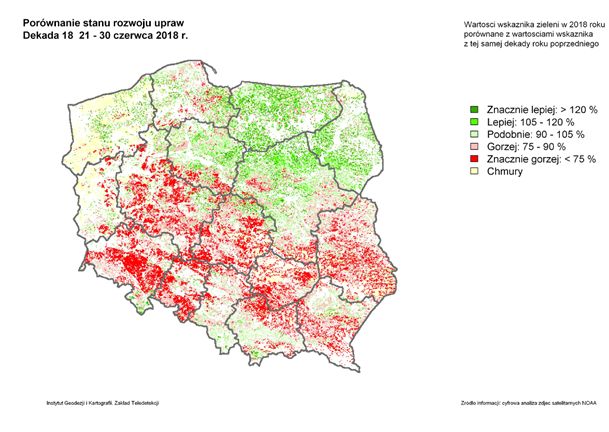
The exemplary comparative maps are presented in figures below for 2012 and 2018 vegetation periods.
 |
 |
| Comparison of crop growth conditions to normal year 18th ten-day period, June 21 – 30, 2018 |
Comparison of crop growth conditions to previous year 18th ten-day period, June 21 – 30, 2018 |
 |
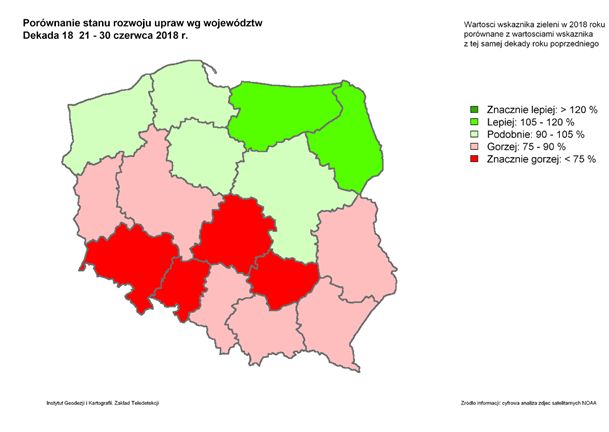 |
| Comparison of crop growth conditions to normal year – voivodship averages 18th ten-day period, June 21 – 30, 2018 | Comparison of crop growth conditions to previous year – voivodship averages 18th ten-day period, June 21 – 30, 2018 |