Flooding in the valleys of the Vistula and Odra rivers
Institute of Geodesy and Cartography once again in its history has used satellite remote sensing methods for mapping flood extent. The first time it was in 1979 during the spring floods on the river Bug, when it was used to develop images taken by the Landsat satellite. In 1997, the mapping coverage of the flood wave on the Oder were used images taken both in the optical as well as in microwave spectrum. This year, to determine the flood wave on the Vistula and San used images taken in the optical spectrum by satellite Terra / MODIS (NASA) and microwave by ERS2 (EURIMAGE).
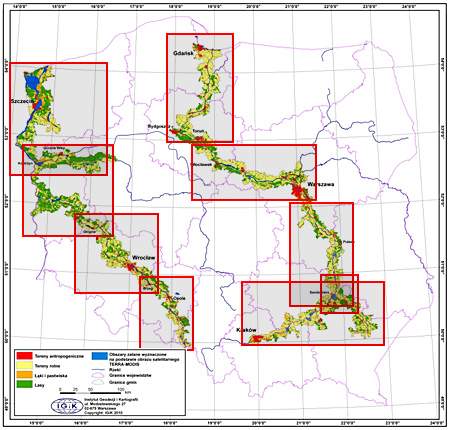
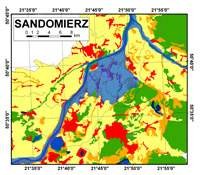
The accompanying maps (click on map) present the situation in the valley of the Vistula and San, on 6 June 2010 and in the valley of Odra on 9 June 2010. The flood wave range has been superimposed on a map showing land use in districts located along both sides of the rivers. Analysis of the maps showed that the water of Vistula river flooded that day over 706 km2, including 34.54 km2 of built-up area, 575.81 km2 of agricultural land and more than 93.5 km2 of forests.
The results were published in Geoinformation Issues 2010, Vol. 2, No. 1.
The article is available in PDF format.
 |
Click on icon to download PDF file. |